
2019 Unofficial Defcon DFIR CTF Writeup - Memory Forensics

For the majority of this section I used Volatility 2.6 under Windows Subsystem for Linux (WSL). As an aside, I commonly use volatility in one of two ways. Most commonly I will run a number of common commands up front and as I progress I will run other less common commands, in each case I redirect the output of the command(s) to txt files which I can then manually review or cat/grep etc, thus reducing processing time that would arise from re-running commands. e.g:
vol.py -f [path_to_memory] --profile[profile] pslist >> [media-id]-pslist.txt
vol.py -f [path_to_memory] --profile[profile] psscan >> [media-id]-psscan.txt
vol.py -f [path_to_memory] --profile[profile] netscan >> [media-id]-netscan.txt
This approach means I can reuse output if later required in analysis. During CTFs and similar I quite often use quick and dirty commands piped to grep to narrow in on answers quickly where I don’t think I will rely upon analysis later. In such cases, a knowledge of the expected output from plugins in advance often means I can do away with the headers in output tables or I can include them with an or statement in grep e.g.:
vol.py -f [path_to_memory] --profile=[profile] pslist | grep -i 'offset\|notepad'
This requires knowledge of a unique string which can be found in the header of the output table for each plugin. In this case I know the pslist header containes ‘Offset’ and I am interested in the ‘notepad’ entry.
Grepping the output of volatility plugins is something memory forensics ninja Alissa Torres (@sibertor) covers in her SANS FOR526 class and it’s really sped up my analysis. There will be a mix of both techniques in the examples that follow.
get your volatility on – 5pts
Question
What is the SHA1 hash of triage.mem?
Answer
No fancy tools needed here a simple sha1sum, in this case using WSL, gives us the answer.
sha1sum \[path_to_file]
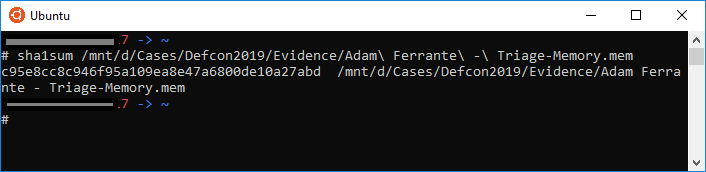
flag<c95e8cc8c946f95a109ea8e47a6800de10a27abd>
pr0file - 10 pts
Question
What profile is the most appropriate for this machine? (ex: Win10x86_14393)
Answer
The first step in most volatility analysis is to use the ‘imageinfo’ plugin:
vol.py -f \[path_to_memory] imageinfo
Reviewing the output, we can see that the plugin presents a few possible profiles, we also review the service pack level to confirm that we require an SP1 profile.
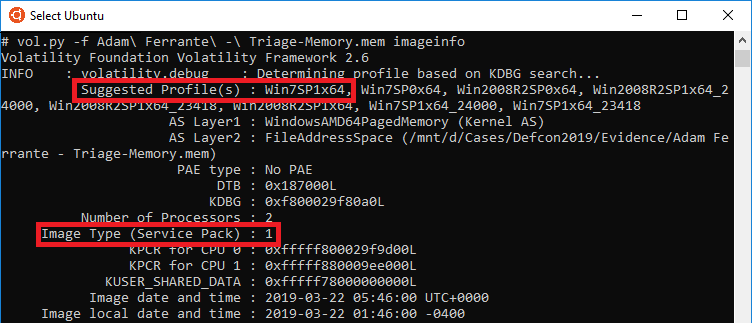
Combining that information, it is possible that a number of other profiles (e.g. Win2008R2SP1x64 or the other kernel variant profiles) would be correct, and it would likely have been possible to use any of them to confirm the exact OS by pulling registry hives from RAM. But in this case, and based on prior experience, I went with ‘Win7SP1x64’ and it was correct.
flag<Win7SP1x64>
hey, write this down - 12 pts
Question
What was the process ID of notepad.exe?
Answer
The 'pslist' command, known profile and a pipe to grep can get us this quickly:
vol.py -f Adam\ Ferrante\ -\ Triage-Memory.mem --profile= Win7SP1x64 pslist | grep -i 'offset\|notepad'

The Process ID (PID) column shows for notepad the PID is 3032.
flag<3032>
wscript can haz children - 14 pts
Question
Name the child processes of wscript.exe.
Answer
The 'pstree' command shows the relationship between parent and children processes, sometimes where there are lots of processes child to a single parent it can be a bit confusing and alternatives like explicitly looking up the PID of the parent and seeing what processed have it as a Parent Process ID (PPID) using 'pslist' (or 'psscan') is the best approach.
In this case 'pstree', the known profile and a pipe to grep with context (-C) is a nice shortcut:
vol.py -f Adam\ Ferrante\ -\ Triage-Memory.mem --profile=Win7SP1x64 pstree | grep wscript -C2
Executing this command results in the following output:
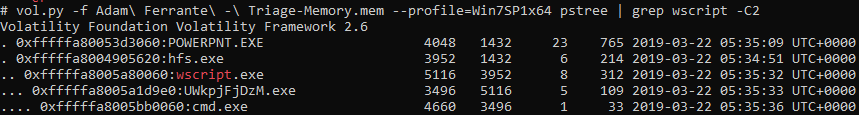
We can see the child process is UWkpjFjDzM.exe.
flag<UWkpjFjDzM.exe>
tcpip settings - 18 pts
Question
What was the IP address of the machine at the time the RAM dump was created?
Answer
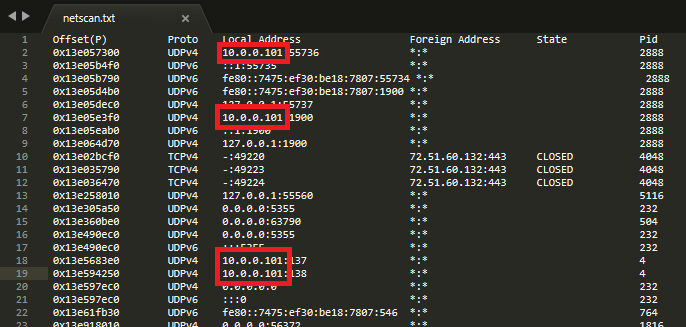
There are a couple of quick ways to skin this cat, but my preference is to use netscan output as it is commonly required later, I piped this to a text file with:
vol.py -f Adam\ Ferrante\ -\ Triage-Memory.mem --profile=Win7SP1x64 netscan >> netscan.txt
Which provided the following output:

Per the above, there are multiple established connections which detail an IPv4 address of 10.0.0.101.
flag<10.0.0.101>
intel - 18 pts
Question
Based on the answer regarding to the infected PID, can you determine what the IP of the attacker was?
Answer
The infected process was the child process spawned from ‘wscript.exe’, ‘UWkpjFjDzM.exe’ or PID 3496.
We can re-review the netscan output written to netscan.txt with:
cat netscan.txt | grep -i 'offset|UWkpjFjDzM'
Which outputs as below:

That process is associated with an established connection to '10.0.0.106':
flag<10.0.0.106>
i <3 windows dependencies - 20 pts
Question
What process name is VCRUNTIME140.dll associated with?
Answer
If you want to know something about loaded dlls, the 'dlllist' plugin is a good place to start. The output is verbose due to us not being able to focus on a single process in this question. The output is a repeating format with a header detailing process information and then a list of the associated dlls. In this case I used the following command to pass all lines which contain details of a process and also pass any instance of ‘VCRUNTIME140’:
vol.py -f Adam\ Ferrante\ -\ Triage-Memory.mem --profile=Win7SP1x64 dlllist | grep -i 'pid\|VCRUNTIME140'
Therefor for the occurance of VCRUNTIME140 we can review the proceeding line in the output and we can conclude that this was the associated process.
To my surprise there were 5 instances associated with different processes.
While I didn’t do this at the time, a tidier approach would be to use:
vol.py -f Adam\ Ferrante\ -\ Triage-Memory.mem --profile=Win7SP1x64 dlllist | grep -i 'pid\|VCRUNTIME140' | grep -i VCRUNTIME140 -B1
This results in the following output:
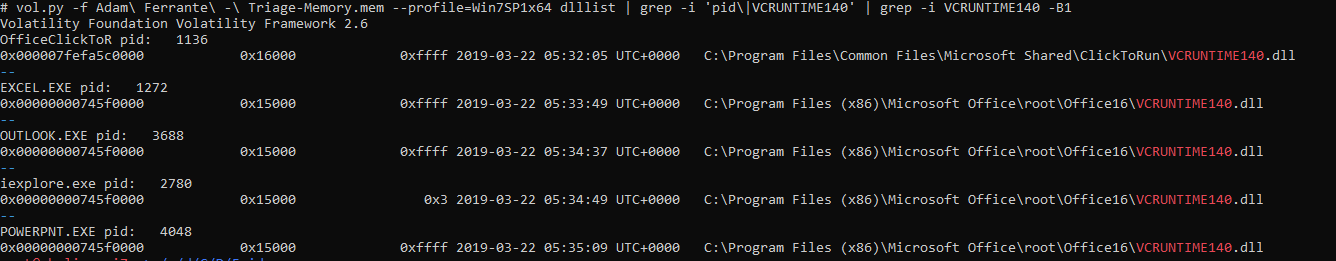
Technically any of these would be a correct answer for “What process name is VCRUNTIME140.dll associated with?”, but OfficeClickToR.exe stood out as unique so I went with that first. From memory, I think I tried them all when that didn’t work, before realising that I had to drop the extension…
flag<OfficeClickToR>
mal-ware-are-you - 20 pts
Question
What is the md5 hash value the potential malware on the system?
Answer
As mentioned earlier, the potential malware is ‘UWkpjFjDzM.exe’ or PID 3496. We can dump this process to the current directory and hash it with a one liner. This is because we know the behaviour of the 'procdump' commend when it comes to naming dumped processes. We specify the output location and the filename will be ‘executable.[pid].exe’
vol.py -f Adam\ Ferrante\ -\ Triage-Memory.mem --profile=Win7SP1x64 procdump -p 3496 -D . && md5sum executable.3496.exe
My AV was unimpressed, but we managed to hash the file before it was quarantined:
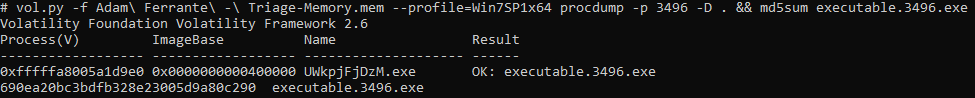
flag<690ea20bc3bdfb328e23005d9a80c290>
lm-get bobs hash - 24 pts
Question
What is the LM hash of bobs account?
Answer
There is a good guide to the required process here.
To answer this question, we need to use the hashdump plugin. However, this plugin needs to be provided with the virtual address of two hives, SAM and System. We retrieve this information with the hivelist plugin:
vol.py -f Adam\ Ferrante\ -\ Triage-Memory.mem --profile=Win7SP1x64 hivelist
Resulting in the following output:
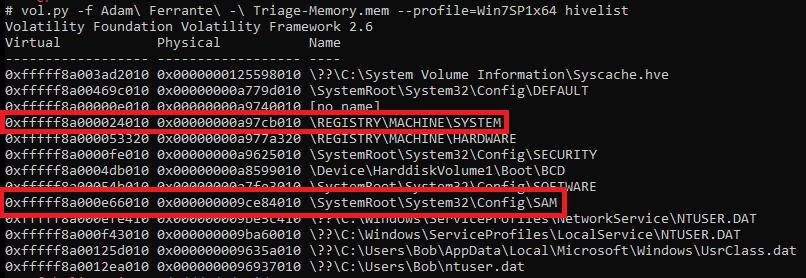
SYSTEM is at: 0xfffff8a000024010
SAM is at: 0xfffff8a000e66010
We can then use the hashdump command to dump the hashes:
vol.py -f Adam\ Ferrante\ -\ Triage-Memory.mem --profile=Win7SP1x64 hashdump -y 0xfffff8a000024010 -s 0xfffff8a000e66010

The format of the resultant output is:
<Username>:<User ID>:<LM hash>:<NT hash>:<Comment>:<Home Dir>:
As such we are interested in the LM component, so ‘aad3b435b51404eeaad3b435b51404ee’, which happens to be the LM hash of a blank password.
flag<aad3b435b51404eeaad3b435b51404ee>
vad the impaler - 25 pts
Question
What protections does the VAD node at 0xfffffa800577ba10 have?
Answer
Information on VAD notes can be returned using the ‘vadinfo’ command. Running it on its own will result in a lot of output, easily piped to a txt file for subsequent review or narrowed down with a grep with context. The firs relevant line will be the one with the VAD note location and the next 10 lines will be more than enough to answer our question:
vol.py -f Adam\ Ferrante\ -\ Triage-Memory.mem --profile=Win7SP1x64 vadinfo | grep '0xfffffa800577ba10' -A 10
This results in the following output:
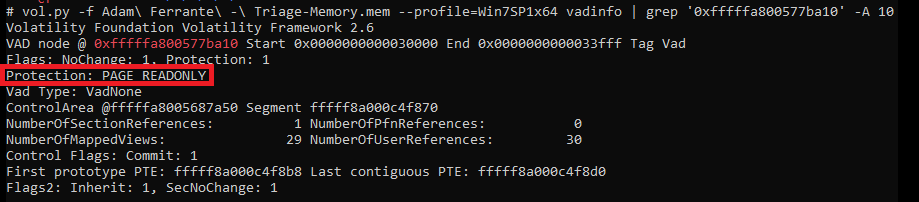
And we can see the protection is ‘PAGE_READONLY’
flag<PAGE_READONLY>
more vads?! - 25 pts
Question
What protections did the VAD starting at 0x00000000033c0000 and ending at 0x00000000033dffff have?
Answer
This time we are seeking the same information but based upon start location and end location. I actually just used the same command but substituted @ value for the start location. However, this approach actually returned multiple results. It was easy enough to distinguish which I was looking for from the mess but in short, I hadn’t noticed in the question that we were talking about a historical VAD hence “What protections did the VAD”.
A cleaner way to find exactly the right answer is as follows:
vol.py -f Adam\ Ferrante\ -\ Triage-Memory.mem --profile=Win7SP1x64 vadinfo | grep '0x00000000033c0000' -A 3 | grep '0x00000000033dffff ' -A 3

flag<PAGE_NOACCESS>
vacation bible school - 25 pts
Question
There was a VBS script run on the machine. What is the name of the script? (submit without file extension)
Answer
I expect there are a number of ways to answer this one, and I tried a few possibilities which didn’t get me to the answer. Ultimately the ‘cmdline’ solved it for me but it may not be the most elegant answer. If a VBS script had been executed via the command line then I would have expected there to be evidence here.
As it was a search for vbs entries within here actually identified that the process wscript.exe (PID 5116) had been executed with the command line detailed below:

flag<vhjReUDEuumrX>
thx microsoft - 25 pts
Question
An application was run at 2019-03-07 23:06:58 UTC, what is the name of the program? (Include extension)
Answer
The shimcache is one of many handy ways to evidence process execution and there is a volatility plugin to parse it from memory, the following query immediately gave the process executed at that time:
vol.py -f Adam\ Ferrante\ -\ Triage-Memory.mem --profile=Win7SP1x64 shimcache | grep '23:06:58'
Resulting in:

So we see that Skype executed at the time in question.
flag<Skype.exe>
lightbulb moment - 35 pts
Question
What was written in notepad.exe in the time of the memory dump?
Answer
There is a ‘notepad’ plugin for Volatility however it only supports XP/2003, so we have to do this manually. Fortunaltely being a common challenge there are a few handy guides out there, including the one located here.
Earlier in ‘hey, write this down’, we identified that the PID assoaicted with notepad.exe is 3032, as such we can dump the process memory with:
vol.py -f Adam\ Ferrante\ -\ Triage-Memory.mem --profile=Win7SP1x64 memdump -D dump -p 3032
We can then run strings over the dumped memory and as a first Hail Mary use grep to parse the output for any string containing ‘flag<’, just in case the challenge author has been kind.
And they have:
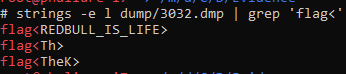
Note that the command used, per the guide linked above, is strings with the ‘-e l’ flag to set it to 16-bit littleendian, as this is how notepad stores content.
flag<REDBULL_IS_LIFE>
8675309 - 35 pts
Question
What is the shortname of the file at file record 59045?
Answer
The ‘mftparser’ plugin is very useful and I had already run it while looking to solve some of the other challenges. Due to the volume of information returned, run time and how often the content gets returned to I piped the output of the command to a text file.
A search of the file for the string ‘59045’ had 2 results, one of which was the relevant one.
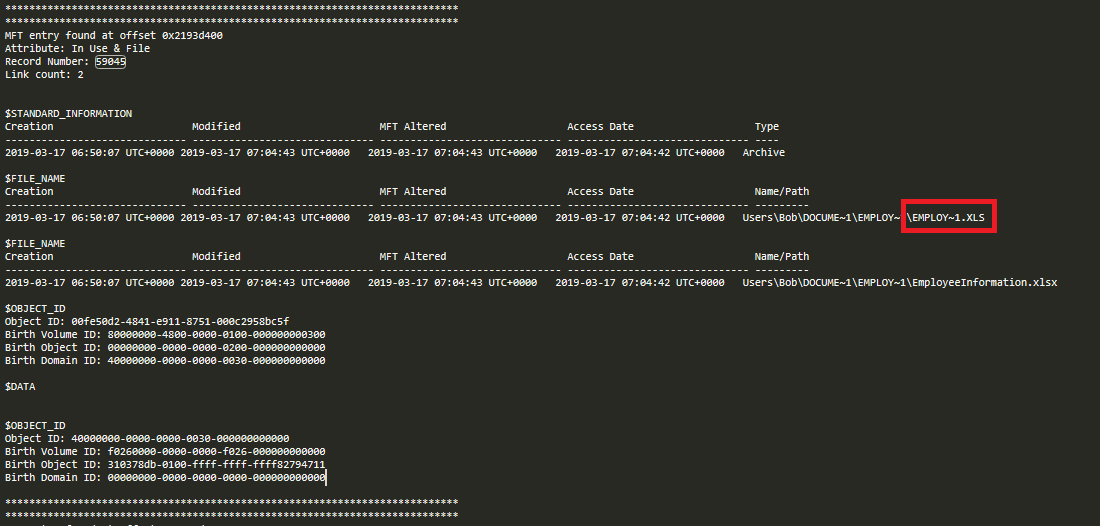
In the screenshot we can quickly see that the short filename associated with this record was ‘EMPLOY~1.XLS’.
flag<EMPLOY~1.XLS>
whats-a-metasploit? - 50 pts
Question
This box was exploited and is running meterpreter. What PID was infected?
Answer
This was a bit of a gimme. Earlier in ‘wscript can haz children’ we identified a malicious process and then in ‘intel’ we used netscan to see what it was communicating with. I noted at the time that it was communicating on port ‘4444’ which will be known to many as the default port for metasploit.
The PID associated with this process was ‘3496’ and lo and behold, it was accepted as the correct answer.
flag<3496>